 This is going to be another one of those posts that will surely help some people, but it is far more likely to help me later 😉 I have culled these techniques from a variety of sources across the Internet, but I’m not entirely sure who taught me what in order to give proper credit.
If you want to follow along, I went to the Microsoft Sql Product Sample Site and downloaded “Adventure Works 2014 Full Database Backup.zip” and unzipped and restored it onto my database server. That gives me the OLTP version (rather than the OLAP) of the 2014 Adventure Works database. To start off, let’s take a look at the following query:
USE AdventureWorks2014
GO

SELECT c.AccountNumber, DATENAME(month, h.OrderDate) as OrderMonthName, SUM(d.LineTotal) as TotalSales
FROM Sales.SalesOrderHeader h
INNER JOIN Sales.SalesOrderDetail d ON h.SalesOrderID = d.SalesOrderID
INNER JOIN Sales.Customer c ON h.CustomerID = c.CustomerID
WHERE YEAR(h.OrderDate) = 2011
GROUP BY c.AccountNumber, DATENAME(month, h.OrderDate)
ORDER BY c.AccountNumber
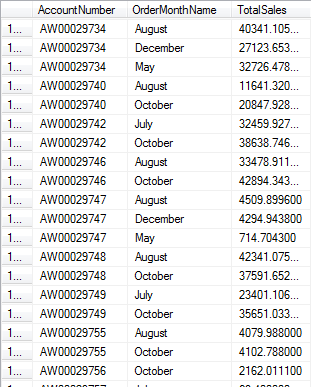
This returns results like these:

However, what if you wanted to easily see how each of those customers’ sales looked month over month in comparison to other customers? Typically, a data analyst might take a result set like that and use a tool like Microsoft Excel to create a pivot table. That would let your rows be per customer and your columns would be per month. Reporting wonks could also use a tool like SSRS to pivot the data for presentation to users. However, if you are using Sql Server 2005 or later, you could also use the PIVOT command.
If your data that you’d like to pivot on has a finite and known quantity, this is very easy. I’m going to change the query above to show how to do that:
USE AdventureWorks2014
GO

;WITH SalesData AS (
	SELECT c.AccountNumber, DATENAME(month, h.OrderDate) as OrderMonthName, CAST(SUM(d.LineTotal) AS NUMERIC(12,2)) as TotalSales
	FROM Sales.SalesOrderHeader h
	INNER JOIN Sales.SalesOrderDetail d ON h.SalesOrderID = d.SalesOrderID
	INNER JOIN Sales.Customer c ON h.CustomerID = c.CustomerID
	WHERE YEAR(h.OrderDate) = 2011
	GROUP BY c.AccountNumber, DATENAME(month, h.OrderDate))

SELECT *
FROM SalesData
PIVOT (SUM(TotalSales) FOR OrderMonthName IN (January, February, March, April, May, June, July, August, September, October, November, December)) pvt
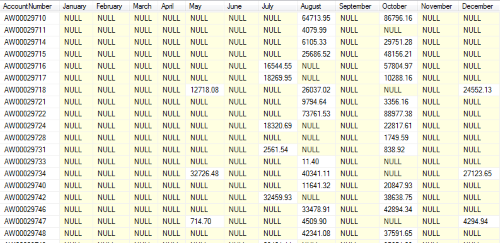
A few peculiar things to notice. First, the values that become the new columns are not quoted. They are treated like literals. I didn’t have to say ‘January’, ‘February’, etc. Secondly, notice that I had to name the pivot table (as pvt here). Even though I don’t reference it, if I omit it, the Sql statement won’t parse and execute. Look at the results below. Notice a third strange thing. Even though I selected out all of the columns (using SELECT *), it did not actually return all columns like you would normally see in a join situation. It showed the AccountNumber column from the SalesData CTE, but then it ignored the OrderMonthNames and TotalSales columns from SalesData. The PIVOT was smart enough to know that those values were being represented in other ways in our new dataset.

If you want/need to get rid of the NULLS in the results, you can do it the same way that you would do it in a regular query. I could change the “SELECT *” to be “SELECT AccountNumber, ISNULL(January, 0.00) AS January, ISNULL(February, 0.00) AS February” and just continue that pattern for each month.
Simple enough and that gets us pretty far along the way. But, what if I wanted to instead see customer sales by product category? I could see every product category that exists in the system right now and do a static pivot. However, everytime someone updated the system with a new product category, we would have to modify our query (potentially many queries across the enterprise). Is there a way to do that?
No, not directly.
However, we can use Dynamic Sql to dynamically determine our static columns, if that makes sense 😉 Let’s take a look at the query needed to just return the standard results, grouped by customer and product category.
USE AdventureWorks2014
GO

SELECT c.AccountNumber, pc.Name + '-' + ps.Name AS CategoryName, CAST(SUM(d.LineTotal) AS NUMERIC(12,2)) as TotalSales
FROM Sales.SalesOrderHeader h
INNER JOIN Sales.SalesOrderDetail d ON h.SalesOrderID = d.SalesOrderID
INNER JOIN Production.Product p ON d.ProductID = p.ProductID
INNER JOIN Production.ProductSubcategory ps ON p.ProductSubcategoryID = ps.ProductSubcategoryID
INNER JOIN Production.ProductCategory pc ON ps.ProductCategoryID = pc.ProductCategoryID
INNER JOIN Sales.Customer c ON h.CustomerID = c.CustomerID
WHERE YEAR(h.OrderDate) = 2011
GROUP BY c.AccountNumber, pc.Name, ps.Name
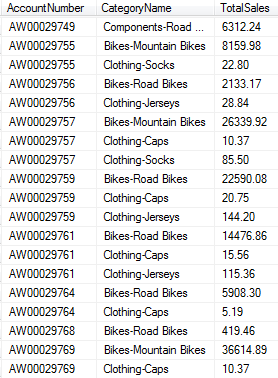
This returns the following results:

There are 8 unique category – subcategory combinations in these results, but it doesn’t take much imagination to see how new products can be added all the time. Probably several new subcategories a year. How can we handle that? The key is those columns listed out in the PIVOT operator definition. Let’s see how we can build that dynamically using a temp table to make working with the data easier.
USE AdventureWorks2014
GO

SELECT c.AccountNumber, pc.Name + '-' + ps.Name AS CategoryName, CAST(SUM(d.LineTotal) AS NUMERIC(12,2)) as TotalSales
INTO #SalesData
FROM Sales.SalesOrderHeader h
INNER JOIN Sales.SalesOrderDetail d ON h.SalesOrderID = d.SalesOrderID
INNER JOIN Production.Product p ON d.ProductID = p.ProductID
INNER JOIN Production.ProductSubcategory ps ON p.ProductSubcategoryID = ps.ProductSubcategoryID
INNER JOIN Production.ProductCategory pc ON ps.ProductCategoryID = pc.ProductCategoryID
INNER JOIN Sales.Customer c ON h.CustomerID = c.CustomerID
WHERE YEAR(h.OrderDate) = 2011
GROUP BY c.AccountNumber, pc.Name, ps.Name

DECLARE @PivotColumns NVARCHAR(MAX), @SqlStatement NVARCHAR(MAX)

SELECT @PivotColumns= ISNULL(@PivotColumns + ',','') + QUOTENAME(CategoryName) FROM (SELECT DISTINCT CategoryName FROM #SalesData) AS Categories

SET @SqlStatement =
	N'SELECT AccountNumber, ' + @PivotColumns + '
    FROM #SalesData
    PIVOT(SUM(TotalSales)
          FOR CategoryName IN (' + @PivotColumns + ')) AS pvt'

EXEC sp_executesql @SqlStatement

DROP TABLE #SalesData
The bulk of the work here is just being done in this line
SELECT @PivotColumns= ISNULL(@PivotColumns + ',','') + QUOTENAME(CategoryName) FROM (SELECT DISTINCT CategoryName FROM #SalesData) AS Categories
That just select a distinct list of categories and builds a comma delimited string out of them. The value in that variable looks like this:
[Bikes-Road Bikes],[Clothing-Socks],[Clothing-Jerseys],[Clothing-Caps],[Components-Mountain Frames],[Accessories-Helmets],[Bikes-Mountain Bikes],[Components-Road Frames]
Because of the spacing in the categories, that’s why we used QUOTENAME. That makes sure the name will work in SQL statements. Ultimately, the executed query looks like this:
SELECT AccountNumber, [Bikes-Road Bikes],[Clothing-Socks],[Clothing-Jerseys],[Clothing-Caps],[Components-Mountain Frames],[Accessories-Helmets],[Bikes-Mountain Bikes],[Components-Road Frames]
FROM #SalesData
PIVOT(SUM(TotalSales) FOR CategoryName IN ([Bikes-Road Bikes],[Clothing-Socks],[Clothing-Jerseys],[Clothing-Caps],[Components-Mountain Frames],[Accessories-Helmets],[Bikes-Mountain Bikes],[Components-Road Frames])) AS pvt
You can see how that is now very much like our initial static example with the months. The query still has the NULL problem, though, so to fix that you can create another variable so the SELECTed columns can contain ISNULL but the PIVOTed columns will not. That looks like this:
USE AdventureWorks2014
GO

SELECT c.AccountNumber, pc.Name + '-' + ps.Name AS CategoryName, CAST(SUM(d.LineTotal) AS NUMERIC(12,2)) as TotalSales
INTO #SalesData
FROM Sales.SalesOrderHeader h
INNER JOIN Sales.SalesOrderDetail d ON h.SalesOrderID = d.SalesOrderID
INNER JOIN Production.Product p ON d.ProductID = p.ProductID
INNER JOIN Production.ProductSubcategory ps ON p.ProductSubcategoryID = ps.ProductSubcategoryID
INNER JOIN Production.ProductCategory pc ON ps.ProductCategoryID = pc.ProductCategoryID
INNER JOIN Sales.Customer c ON h.CustomerID = c.CustomerID
WHERE YEAR(h.OrderDate) = 2011
GROUP BY c.AccountNumber, pc.Name, ps.Name


DECLARE @PivotColumns NVARCHAR(MAX), @SelectColumns NVARCHAR(MAX), @SqlStatement NVARCHAR(MAX)

SELECT @PivotColumns= ISNULL(@PivotColumns + ',','') + QUOTENAME(CategoryName) FROM (SELECT DISTINCT CategoryName FROM #SalesData) AS Categories
SELECT @SelectColumns = ISNULL(@SelectColumns + ',','') + CategoryName FROM (SELECT DISTINCT 'ISNULL(' + QUOTENAME(CategoryName) + ', ''0.00'') AS ' + QUOTENAME(CategoryName) AS CategoryName FROM #SalesData) AS Categories

SET @SqlStatement =
	N'SELECT AccountNumber, ' + @SelectColumns + '
    FROM #SalesData
    PIVOT(SUM(TotalSales)
          FOR CategoryName IN (' + @PivotColumns + ')) AS pvt'

EXEC sp_executesql @SqlStatement

DROP TABLE #SalesData
Basically, I just made the distinct list of category names to be a distinct list of category names wrapped in ISNULL. Then I used the @SelectColumns variable in the select statement and the @PivotColumns variable in the pivot list. The resulting Sql looks like this:
SELECT AccountNumber, ISNULL([Accessories-Helmets], '0.00') AS [Accessories-Helmets],ISNULL([Components-Mountain Frames], '0.00') AS [Components-Mountain Frames],ISNULL([Clothing-Caps], '0.00') AS [Clothing-Caps],ISNULL([Components-Road Frames], '0.00') AS [Components-Road Frames],ISNULL([Bikes-Road Bikes], '0.00') AS [Bikes-Road Bikes],ISNULL([Clothing-Socks], '0.00') AS [Clothing-Socks],ISNULL([Clothing-Jerseys], '0.00') AS [Clothing-Jerseys],ISNULL([Bikes-Mountain Bikes], '0.00') AS [Bikes-Mountain Bikes]
    FROM #SalesData
    PIVOT(SUM(TotalSales)
          FOR CategoryName IN ([Bikes-Road Bikes],[Clothing-Socks],[Clothing-Jerseys],[Clothing-Caps],[Components-Mountain Frames],[Accessories-Helmets],[Bikes-Mountain Bikes],
[Components-Road Frames])) AS pvt
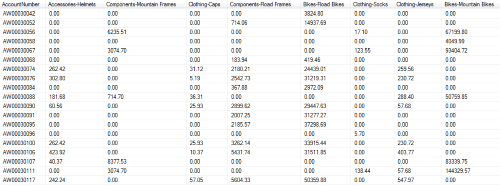
And the resulting data looks like this:

Hopefully you find this helpful (I’m sure future me will be back here). If you have any questions, let me know in the comments.